

Waking the demon

First and foremost, I would like to apologize to my subscribers. I was away for more than two months fighting a strange illness that doctors couldn’t pinpoint. It left me somewhat inebriated. I am back now, and have fully recovered!
The good news is that during my period of inebriation it seems like some of the companies I spoke about previously have been performing well! More on that later.
Hello inflation
The inflation I spoke about almost 6 months ago is finally here in all its raging glory.
When one analyses prices of different goods over an extended period (years) they will see many goods fluctuating in price. Some goods will rise in price, others will fall. Technology and automation have created a profound disinflationary effect and have led to the flattening of the Phillips Curve (low unemployment having little effect on inflation compared). Up until the pandemic, sources of inflation have been relatively subdued. Now they have awakened in a perfect confluence of events. Supply and demand shocks, fiscal and monetary stimulus, and an increase in the monetary supply, unlike anything we have ever seen before. The perfect inflationary storm.
The Pandemic has led to a perfect inflationary environment, by way of a drastic increase in the money supply, supply-chain disruptions, and now more recently a global energy crisis. Policymakers asserted that inflation would be transitory, but there are hints of dissent coming from within the establishment at just how long ‘transitory’ is.
Sources of inflation
Inflation is spawned from many different sources, academics and economists like to attribute inflation to being cost-push (costs of inputs rising) or demand-pull (increasing demand for products). Put more simply, inflation can be looked at from a supply/demand perspective.
Sources of inflation:
Changes in the money supply.
Reduced supply = higher inflation.
Increased demand = higher inflation.
Changes in the money supply. More money chasing fewer goods.
1 and 2 are easy to understand, but number 3- a change in the money supply affects inflation differently.
Reduced Supply and Increased Demand
Demand and supply are intertwined in nature. They are part of the same fabric. When supply for a good is reduced, is it not the demand for that scarce good that drives the price up?
A lack of supply can come from many directions and currently, they are coming from every direction:
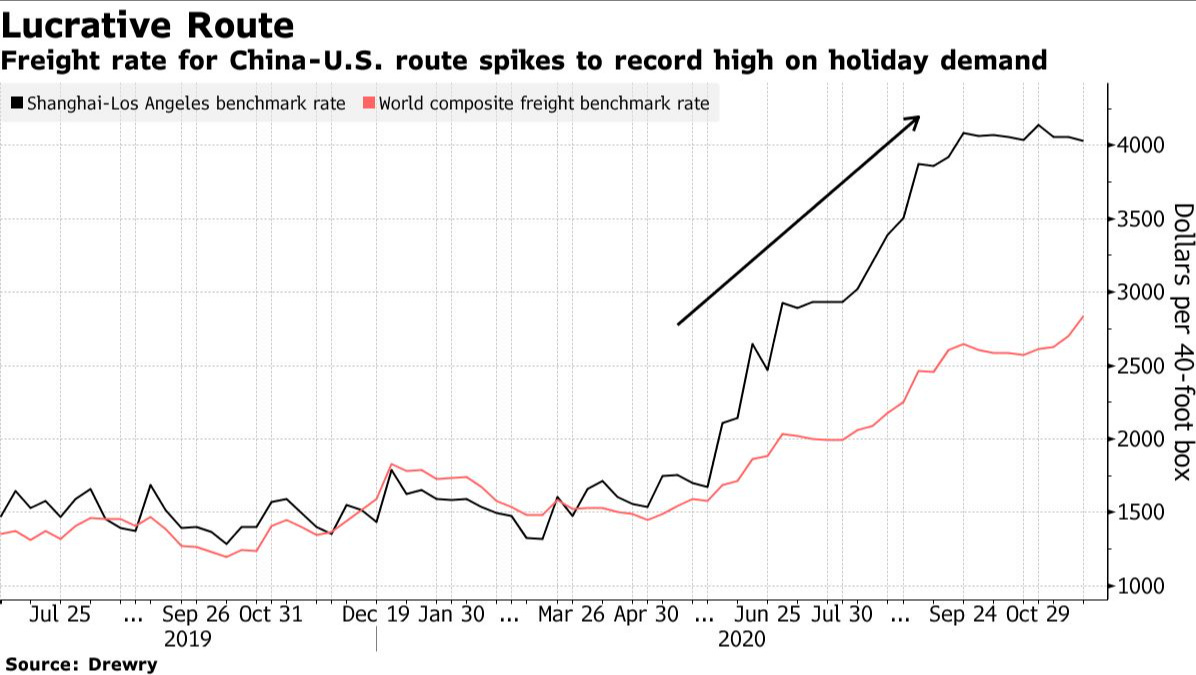
Freight price increase - a record high.
Trucker shortage - leading to shortages in stores. (Labor shortages in general)
Energy crises - increased prices in coal/uranium/natural gas/crude -
Fertilizer prices increasing (you need natural gas to produce ammonia and energy from fossil fuels to mine for phosphate. You need ammonia and phosphate to make fertilizer.)
Food price increases next?
The list of prices that have increased due to shortages goes on, the ones mentioned above are closer to the source of inflation, and inflation does not end with them, it rather begins with them and spreads into other goods and other parts of the economy.
Changes in the money supply
Inflation is always and everywhere a monetary phenomenon in the sense that it is and can be produced only by a more rapid increase in the quantity of money than in output - Milton Friedman
Milton Friedman would’ve been shocked to see policymakers actively testing the validity of his statement (yet again) by increasing the quantity of money (money supply) by 15% in the space of 4 months. This 15% increase is only M2 and doesn’t include other forms of stimulus. (So it’s a conservative figure).
From March 1991 to January 2001 (10 year period) the M2 Money supply (M2: includes cash, checking deposits, and easily convertible near money) increased 4.12% per year. This is not inflation, this is just the increase in the money supply or ‘monetary expansion’, and the increase in the money supply generally keeps up with GDP growth and inflation (or inflation tries to keep up with the money supply).
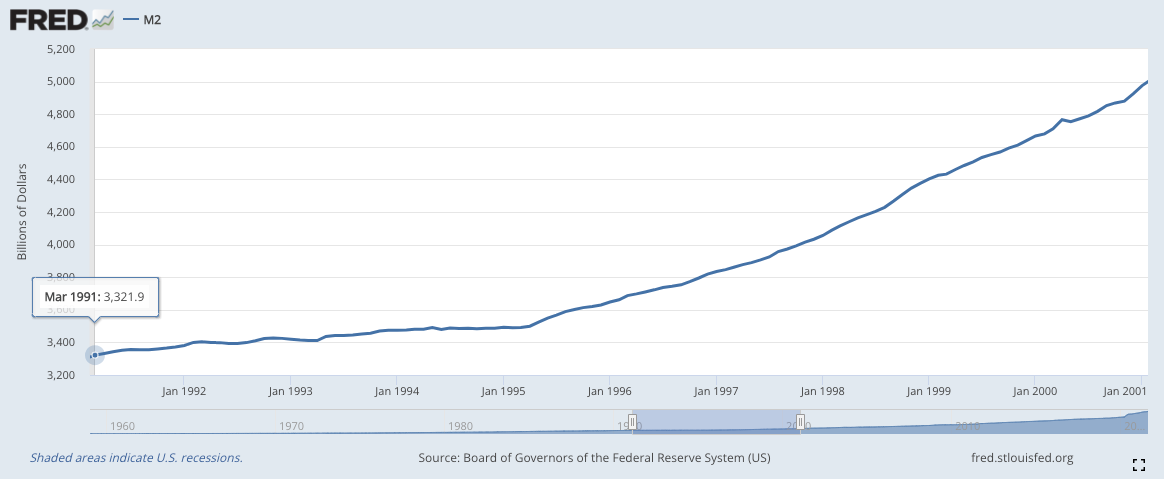
The graph below also shows the M2 money supply from September 2011 to August 2021 (10 year period). The M2 money supply increased at 8.12% (annualized- year on year) during this period, with the majority of the increase coming from the stimulus that was provided. In the 4 months from February 2020 to May 2020, the M2 money supply increased 15.6%! (Milton Friedman would’ve had a heart attack).

March 1991 to January 2001 (10 year period) - 4.12% annual increase
September 2011 to August 2021 (10 year period) - 8.12% annual increase (double compared to 1991 - 2001).
The M2 money supply is not the only indicator to look at, the Federal Reserve has kept interest rates very low since the global financial crisis in 2008. Central banks like the Federal Reserve keep interest rates low by actively buying bonds in the market pushing their prices up, and the interest they offer down. This is why most of the developed world has such low mortgage rates.
The Federal Reserve and other central banks reacted to the pandemic by lowering interest rates further. Congress then passed bills to save certain industries, sent out stimulus checks to families, and used a variety of other methods to stimulate the economy through the pandemic. A large portion of the money ended up in the stock market as was seen by the massive increase in retail traders who suddenly began to participate in the stock market with the free money they received from the government.
Smart investors used this abnormally low-interest-rate environment to take out a mortgage and invest in property. A decent inflation hedge as the bank ends up paying for the property (in real terms). Note: This doesn’t generally work in developing countries where interest rates are high.
From July 2020 to July 2021 the S&P/Case Shiller U.S National Home Price Index rose by 20%

The S&P/Case-Shiller National Price Index only takes into account sales, so the index can be misleading because it doesn’t take into account increases in the value of properties that have not been sold.
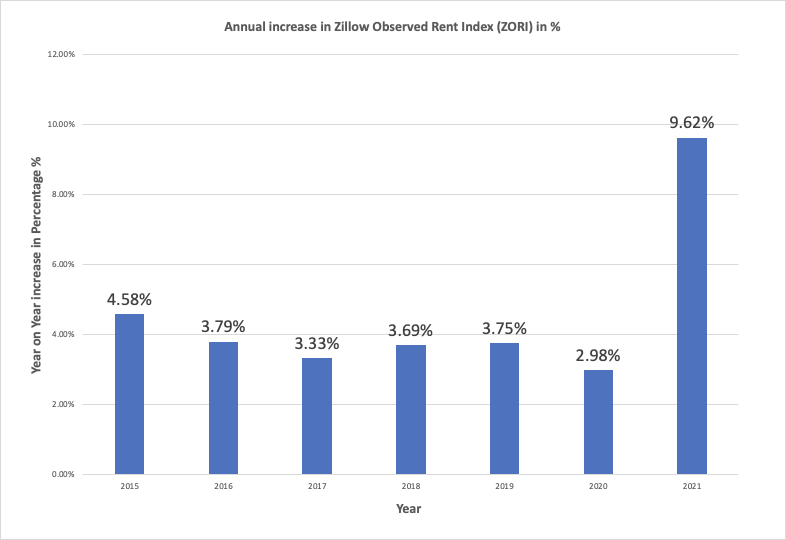
A different (not better per se) index would be ZORI - Zillow observed rent index. Also, because house prices were removed from CPI in 1983, “This was partly because indexing benefits and pensions to inflation had become expensive and some politicians wanted to bring measured inflation down.”
Inflation became somewhat political and so policymakers removed it, effectively lowering the ‘reported’ inflation. House prices were replaced with rent prices, which didn’t move up as fast. Policymakers talking about excluding certain goods when looking at inflation seems to be making their way back in fashion.
In 2021, rent prices increased 9.62% (~3 times faster than the average prior 6 year period).
A look into the past
Increases in the money supply are referred to as ‘monetary expansions’, and this is not the first ‘monetary expansion’ America has seen. In October of 1962 America began a monetary expansion that extended through the next 11 years. The increase in money supply began at a rate of 4.6% for the first 3 and a half years and reached 7.2% per year for another 2 years. Compare this rate of increase with the 8.12% per year increase I referred to above.
Remember, this is not inflation in the general sense. This is just an increase in the monetary supply. And so where does that money go? Generally, periods of increased monetary supply are correlated with booming stock markets. The money gets ‘trapped’ or ‘diverted’ so to speak in the stock market, far away from day-to-day items that are included in the CPI.
The monetary expansion party ended around December 1969 when inflation started reaching up to 6% and the United States entered into recession.
The lesson? The money supply is often overlooked because its immediate effect on inflation is subdued. But history has shown on more than one occasion that increases in the money supply eventually lead to inflationary spirals.
Where to now?
Presidents, politicians, and policymakers are reactive rather than proactive because their incentives are linked to a shorter time frame. They will use the current environment and work their narrative around it, point fingers in an attempt to lever their political gain. Of course, they don’t mean to be bad, but human nature is fickle and predictable in most cases.
The men who are supposedly in charge of inflation have conflicting interests and however independent they claim to be, they are still playing in the political arena.
As we look into the near term future a few things are relatively certain:
There is an energy crisis that could be exacerbated as countries further open up, as well as the developed world entering winter.
The energy crisis seems to be making its way into different parts of the economy- fertilizer/foods/commodities etc.
Rent prices are lagging behind house prices and are beginning to increase.
Labor shortages are everywhere.
There is a looming threat from a past increase in the monetary supply.
There are supply-chain issues that are causing increases in prices of goods and shortages in those goods.
There is of course disinflation in some goods, but from gauging from the overall picture, inflationary pressures are more likely to persist into the future until we see a reaction from central banks.