


The American consumer squeeze
May CPI coming in hot?

Determinism and investing
The story of life is a sequence of events in the medium of space/time. If you had the computing power, and all the information the world has to offer, you could probably predict the future. "Determinism”.
Fortunately, we do not have the computing power or all the information we need that would make life very boring indeed- if it was 100% predictable to us.
The global direction of the market and the global economy is very difficult to predict, which is why we need to simplify it, and only make decisions when most of the data is pointing in a pretty obvious direction. It’s a difficult game, but the only one really worth playing.
Where does the data point now?
The Consumer
Here is your average household’s budget in 2020 when COVID reduced transportation costs because everybody worked from home.
Your median household income is around $67,000.

Let’s take some notes:
Housing is by far the biggest cost.
Transportation is the second biggest cost.
Then Income taxes and Food.
“Other” consists of apparel, entertainment, cash contributions, education…
Now let’s dig into a “renter” and their financial situation.
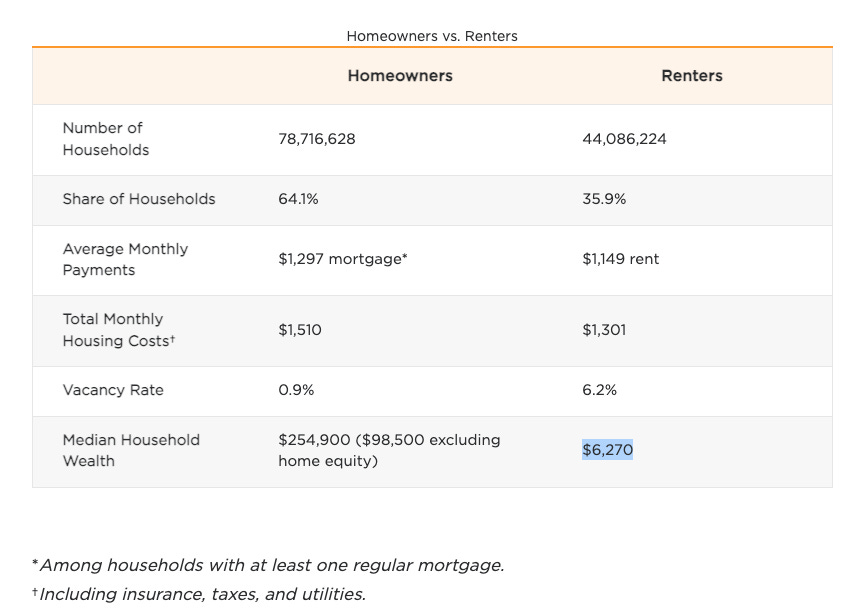
Take a look at the table below. Renters have a weaker balance (by far) compared to a homeowner and account for 36% of households. What would hurt this portion of the population the most?
-Increased rent prices.
-Increased fuel prices.
Renters
When a consumer is hurting, where do they go first? There should be symptoms we can spot in the data that would show us whether they are really hurting or not- Credit data.
Consumers are loaning.

The chart below is a positive for US consumers. Personal savings as a % of disposable income is still in-line with the period after the global financial crisis.

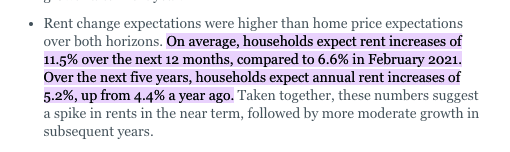
The pain will be felt by the 36% of renters. They now expect rent prices to increase drastically. The pain has already started, below is the 2022 SCE Housing Survey. 12.3% of renters were unable to make a rent payment.
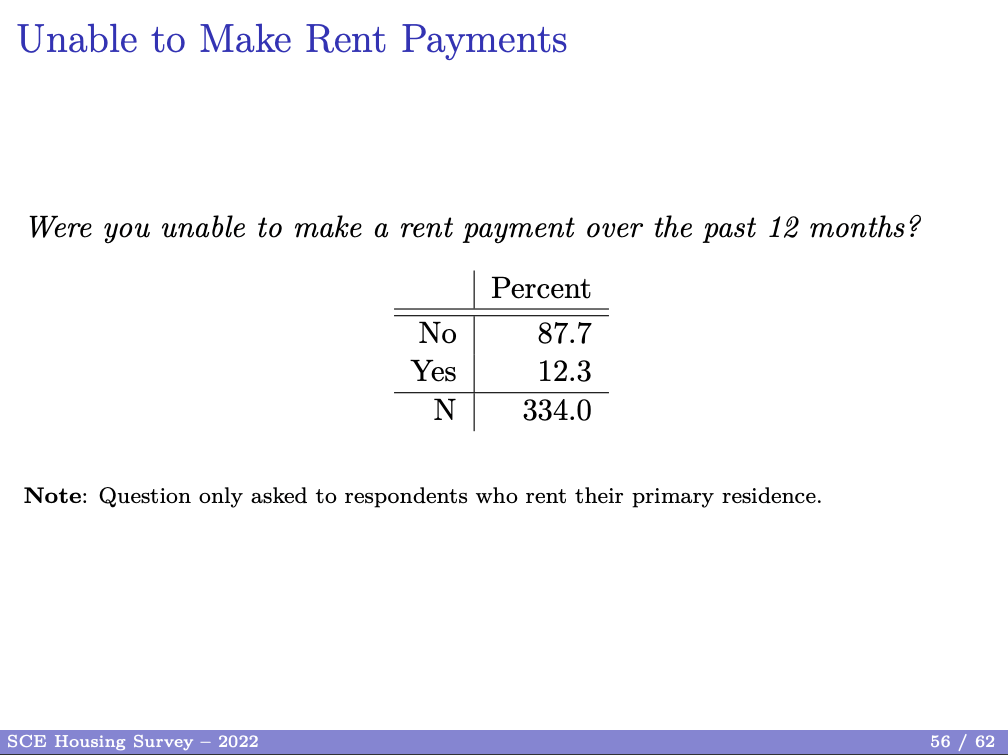
This is an increase from 8.3% in 2019.

13.5% of respondents have cited an “Increase in rent” as a reason for missing payments. Compared to 5.8% in 2019.

Renter Unique problems
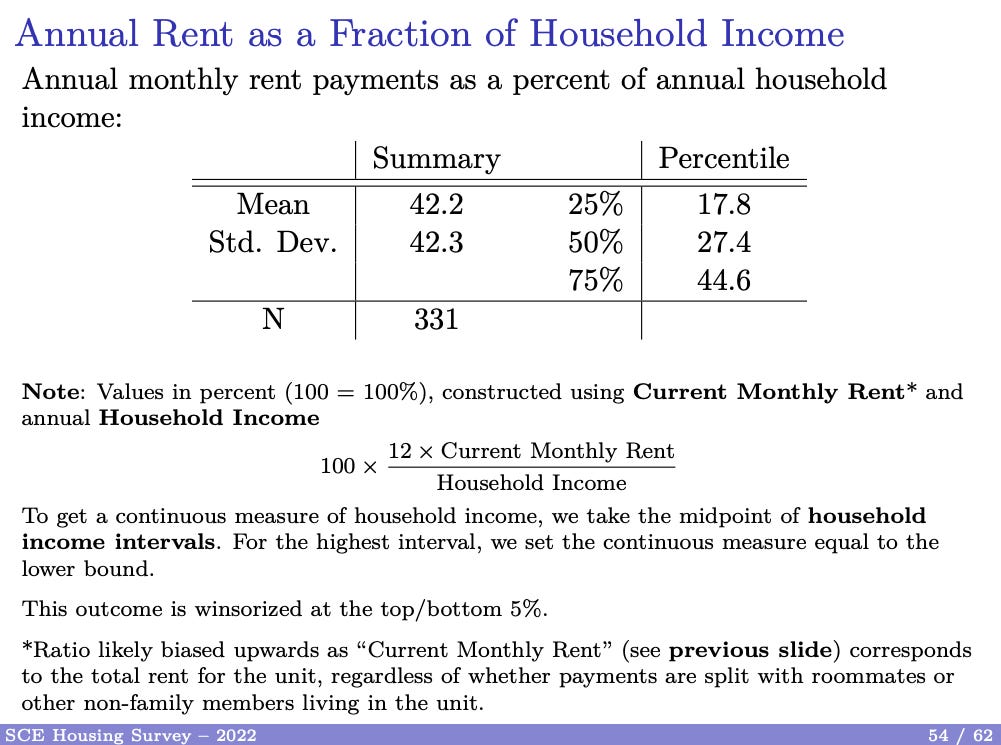
In the first pie chart, we saw that households spend 30% of their income on rent. This number increases to a percentage of 42.2% (see below) when looking at a renter.
Keep in mind that the next biggest expense for a renter is transportation, and I can assure you that your typical renter is probably not driving a Tesla, so they are paying the current gas prices.
It is well documented that consumers re-direct spending after oil price shocks. Consumers start to make new spending decisions, to compensate for higher prices.

May CPI
Given that the Federal Reserve is solely focused on inflation data at the moment, the May CPI print, coming out on Friday is going to be an important piece of data.
The heaviest weighting in CPI is housing. And the Fed made sure to remove housing price increases from inflation data in the 1950s because well…there was too much inflation. That left us with Shelter inflation, which is rampant now.
To Conclude
The bottom quartile of consumers in the US are getting pinched hard. We are going to see this reflect in discretionary expenditures. Consumers are going to keep paying for utilities but the money that previously went to entertainment, luxury products, and other consumer-discretionary (non-essential goods) will vanish for a good portion of the population.
The richer portion of the population, like the house-owners, may reduce some of their expenses, like pension contributions. This leads to the “wealth effect” when amidst economic uncertainty, savers stop investing which leads to a liquidity problem in the market, and increased volatility.
Wages are sticky and slower to rise and are not keeping up with the pace of inflation. Rising wages will put margin pressure on companies and lead to margin compression. A market that was trading at a multiple of 25 price-to-earnings could easily start trading higher (become more expensive) because earnings will drop (denominator) but prices will remain the same.